|
Proteintech
hrp conjugated goat anti rabbit ab Hrp Conjugated Goat Anti Rabbit Ab, supplied by Proteintech, used in various techniques. Bioz Stars score: 98/100, based on 1 PubMed citations. ZERO BIAS - scores, article reviews, protocol conditions and more https://www.bioz.com/product/mouse+rabbit+proteintech+rrid+ab+1/Goat+anti-rabbit+IgG+(H%2BL)%2C+HRP+conjugate/pmc05341883-213-4-9 Average 98 stars, based on 1 article reviews
hrp conjugated goat anti rabbit ab - by Bioz Stars,
2026-10
98/100 stars
|
Buy from Supplier |
|
Proteintech
rabbit anti ifitm3 polyclonal ab  Rabbit Anti Ifitm3 Polyclonal Ab, supplied by Proteintech, used in various techniques. Bioz Stars score: 95/100, based on 1 PubMed citations. ZERO BIAS - scores, article reviews, protocol conditions and more https://www.bioz.com/product/mouse+rabbit+proteintech+rrid+ab+1/IFITM3+Antibody/bio_rxiv__2021__04__06__438585-164-50-57 Average 95 stars, based on 1 article reviews
rabbit anti ifitm3 polyclonal ab - by Bioz Stars,
2026-10
95/100 stars
|
Buy from Supplier |
|
Proteintech
anti bax Anti Bax, supplied by Proteintech, used in various techniques. Bioz Stars score: 96/100, based on 1 PubMed citations. ZERO BIAS - scores, article reviews, protocol conditions and more https://www.bioz.com/product/mouse+rabbit+proteintech+rrid+ab+1/BAX+Antibody/pmc05802038-45-6-61 Average 96 stars, based on 1 article reviews
anti bax - by Bioz Stars,
2026-10
96/100 stars
|
Buy from Supplier |
|
Cell Signaling Technology Inc
mouse anti ifitm1 monoclonal ab  Mouse Anti Ifitm1 Monoclonal Ab, supplied by Cell Signaling Technology Inc, used in various techniques. Bioz Stars score: 93/100, based on 1 PubMed citations. ZERO BIAS - scores, article reviews, protocol conditions and more https://www.bioz.com/product/mouse+rabbit+proteintech+rrid+ab+1/IRAK1+Rabbit+mAb/pm36970857-368-40-80 Average 93 stars, based on 1 article reviews
mouse anti ifitm1 monoclonal ab - by Bioz Stars,
2026-10
93/100 stars
|
Buy from Supplier |
|
Proteintech
anti mouse ptgs2 ab  Anti Mouse Ptgs2 Ab, supplied by Proteintech, used in various techniques. Bioz Stars score: 96/100, based on 1 PubMed citations. ZERO BIAS - scores, article reviews, protocol conditions and more https://www.bioz.com/product/mouse+rabbit+proteintech+rrid+ab+1/COX2%2F+Cyclooxygenase+2%2F+PTGS2+Antibody/pmc10637087-41-7-12 Average 96 stars, based on 1 article reviews
anti mouse ptgs2 ab - by Bioz Stars,
2026-10
96/100 stars
|
Buy from Supplier |
|
Proteintech
b cell lymphoma 2 bcl2 mouse monoclonal ab  B Cell Lymphoma 2 Bcl2 Mouse Monoclonal Ab, supplied by Proteintech, used in various techniques. Bioz Stars score: 96/100, based on 1 PubMed citations. ZERO BIAS - scores, article reviews, protocol conditions and more https://www.bioz.com/product/mouse+rabbit+proteintech+rrid+ab+1/CEL+Antibody/pmc10215342-99-85-93 Average 96 stars, based on 1 article reviews
b cell lymphoma 2 bcl2 mouse monoclonal ab - by Bioz Stars,
2026-10
96/100 stars
|
Buy from Supplier |
|
Proteintech
rabbit polyclonal affinity purified anti ifngr2 ab  Rabbit Polyclonal Affinity Purified Anti Ifngr2 Ab, supplied by Proteintech, used in various techniques. Bioz Stars score: 93/100, based on 1 PubMed citations. ZERO BIAS - scores, article reviews, protocol conditions and more https://www.bioz.com/product/mouse+rabbit+proteintech+rrid+ab+1/IFNGR2+Antibody/pm18493979-301-28-35 Average 93 stars, based on 1 article reviews
rabbit polyclonal affinity purified anti ifngr2 ab - by Bioz Stars,
2026-10
93/100 stars
|
Buy from Supplier |
|
Proteintech
anti ndufs7 rabbit polyclonal ab Anti Ndufs7 Rabbit Polyclonal Ab, supplied by Proteintech, used in various techniques. Bioz Stars score: 93/100, based on 1 PubMed citations. ZERO BIAS - scores, article reviews, protocol conditions and more https://www.bioz.com/product/mouse+rabbit+proteintech+rrid+ab+1/NDUFS7+Antibody/pmc06486330-549-113-122 Average 93 stars, based on 1 article reviews
anti ndufs7 rabbit polyclonal ab - by Bioz Stars,
2026-10
93/100 stars
|
Buy from Supplier |
|
Santa Cruz Biotechnology
anti cyp27b1 Anti Cyp27b1, supplied by Santa Cruz Biotechnology, used in various techniques. Bioz Stars score: 93/100, based on 1 PubMed citations. ZERO BIAS - scores, article reviews, protocol conditions and more https://www.bioz.com/product/mouse+rabbit+proteintech+rrid+ab+1/CYP27B1+Antibody/pmc05743363-291-29-34 Average 93 stars, based on 1 article reviews
anti cyp27b1 - by Bioz Stars,
2026-10
93/100 stars
|
Buy from Supplier |
|
Proteintech
anti mouse srebp2 ab  Anti Mouse Srebp2 Ab, supplied by Proteintech, used in various techniques. Bioz Stars score: 96/100, based on 1 PubMed citations. ZERO BIAS - scores, article reviews, protocol conditions and more https://www.bioz.com/product/mouse+rabbit+proteintech+rrid+ab+1/SREBF2+Antibody/pmc10637087-41-16-21 Average 96 stars, based on 1 article reviews
anti mouse srebp2 ab - by Bioz Stars,
2026-10
96/100 stars
|
Buy from Supplier |
|
Proteintech
anti rabbit igg ab Anti Rabbit Igg Ab, supplied by Proteintech, used in various techniques. Bioz Stars score: 96/100, based on 1 PubMed citations. ZERO BIAS - scores, article reviews, protocol conditions and more https://www.bioz.com/product/mouse+rabbit+proteintech+rrid+ab+1/Heavy+chain+of+Rabbit+IgG+Antibody/pmc06290586-58-42-47 Average 96 stars, based on 1 article reviews
anti rabbit igg ab - by Bioz Stars,
2026-10
96/100 stars
|
Buy from Supplier |
|
Proteintech
rabbit anti vegf polyclonal ab Rabbit Anti Vegf Polyclonal Ab, supplied by Proteintech, used in various techniques. Bioz Stars score: 96/100, based on 1 PubMed citations. ZERO BIAS - scores, article reviews, protocol conditions and more https://www.bioz.com/product/mouse+rabbit+proteintech+rrid+ab+1/VEGF+Antibody/pmc12751086-56-53-59 Average 96 stars, based on 1 article reviews
rabbit anti vegf polyclonal ab - by Bioz Stars,
2026-10
96/100 stars
|
Buy from Supplier |
Image Search Results
Journal: bioRxiv
Article Title: The lysine-rich intracellular loop and cell type-specific co-factors are required for IFITM3 antiviral immunity in hematopoietic stem cells
doi: 10.1101/2021.04.06.438585
Figure Lengend Snippet: THP1 were transduced with a KO-LV expressing both Crispr-Cas9 protein and RNA guide against Cyclophilin A (A), Cyclophilin D or F (B) and then re-challenged with a vector after 24h of stimulation with IFNα. Values are presented as mean ± SEM (n=5-3), p values are for Mann Whitney test. * for p<0.05, **for p<0.01. Cyclophilins knock-out was verified by WB at the time of transduction (TD) (n=3). C. VSV-G wild-type (WT) and mutant LV titers were measured by FACS analysis in THP1 over-expressing IFITM3 and controls. Data are presented as mean ± SEM (n=3). D. CB-HSPC were transduced with VSV-G wild-type or mutant LV in presence or absence of CsH. Transduction efficiencies were measured by FACS five days after TD. Data are presented as mean ± SEM (n=3). E-F. THP1 over-expressing IFITM3 or controls (E) and HSPC were transduced with VSV-G LV in presence or absence of CsH, Amphotericin B or the combination of the two compounds. TD levels were evaluated at FACS 5 days post TD. Data are shown as mean ± SEM (n=5-2), p values are for Mann Whitney test. * for p<0.05, **for p<0.01. G-M. THP1 over-expressing (Oe) IFITM3 and controls were transduced with BaEV-TR (n=9) (G), Measles (n=7) (H) or RD114 (n=6) (I) envelope-pseudotyped LV at MOI 1 and AAV6 (n=5) (L) at MOI 10000. Transduction levels were assessed by FACS five days after TD for LV and three days after TD for AAV6. M. AAV6 transduction was evaluated in CB-HSPC treated or not with CsH three days post-TD (n=4). Data are presented as mean ± SEM (n=4).
Article Snippet: Whole cell extracts were prepared as previously described ( , ).Samples were subjected to SDS-PAGE, transferred to PVDF membrane by electroblotting, and blotted with mouse polyclonal antibody CypA Ab (1:500 dilution, Santa-Cruz Biotechnology catalogue number sc-134310); mouse monoclonal antibody (Ab) raised against CypD/F (1:1000 dilution, Abcam catalogue number [E11AE12BD4] ab110324),
Techniques: Transduction, Expressing, CRISPR, Plasmid Preparation, MANN-WHITNEY, Knock-Out, Mutagenesis

Journal: bioRxiv
Article Title: The lysine-rich intracellular loop and cell type-specific co-factors are required for IFITM3 antiviral immunity in hematopoietic stem cells
doi: 10.1101/2021.04.06.438585
Figure Lengend Snippet: A-B-D-E . THP1 pre-stimulated or not for 24h with IFNα ( A-D ) and human CB-HSPC ( B-E ) were transduced with VSV-G LV in presence or absence of CsH, the proteasomal inhibitor MG132, the lysosomal inhibitor Bafilomycin or the combination of CsH with one of the two inhibitors. Transduction efficiency was evaluated at FACS five days post-TD. Data are presented as mean ± SEM (n=6-3), p values are for Mann Whitney test,* for p<0.05, **for p<0.01, ***for p<0.001, ****for p<0.0001. C-F. IFITM3 protein expression was measured by WB after an O/N treatment with CsH, MG132, Bafilomycin or the combination of CsH with one of the two inhibitors in THP1 pre-stimulated with IFNα, one representative image is shown. IFITM3 was quantified and normalized to Actin using ImageJ (n=3-5). G. IFITM3 protein was quantified in THP1 treated or not with Bafilomycin using ImageJ, normalization was performed over Actin. Data are shown as mean ± SEM (n=6), p values are for Wilcoxon test, * for p<0.05. H. Immunofluorescence images were performed using TCS SP5 Leica confocal microscope, 60x with oil on human HSPC treated or not with CsH, MG132, Bafilomycin or the combination of CsH with one of the two inhibitors. Representative zoomed images are shown (n=6). IFITM3 integrated density was quantified by ImageJ. I. Co-localization of IFITM3 (in red) with the lysosome associated membrane protein 1 (LAMP1) marker (in violet) was evaluated in HSPC by immunofluorescence using TCS SP5 Leica confocal microscope 60x with oil (n=6 images).
Article Snippet: Whole cell extracts were prepared as previously described ( , ).Samples were subjected to SDS-PAGE, transferred to PVDF membrane by electroblotting, and blotted with mouse polyclonal antibody CypA Ab (1:500 dilution, Santa-Cruz Biotechnology catalogue number sc-134310); mouse monoclonal antibody (Ab) raised against CypD/F (1:1000 dilution, Abcam catalogue number [E11AE12BD4] ab110324),
Techniques: Transduction, MANN-WHITNEY, Expressing, Immunofluorescence, Microscopy, Membrane, Marker

Journal: bioRxiv
Article Title: The lysine-rich intracellular loop and cell type-specific co-factors are required for IFITM3 antiviral immunity in hematopoietic stem cells
doi: 10.1101/2021.04.06.438585
Figure Lengend Snippet: A. THP1 over-expressing IFITM3 wild-type, IFITM3-Y20 mutants and controls were transduced with BaEV-TR LV, RD114 LV and Measles LV at MOI 0,5-1 with or without CsH. Transduction efficiency was measured by FACS five days after transduction. Data are presented as mean ± SEM (n=6-5), p values are for Mann Whitney test, * for p<0.05, **for p<0.01, ***for p<0.001, ****for p<0.0001. B. Immunofluorescence images were performed using TCS SP5 Leica confocal microscope, 60x with oil on THP1 over-expressing IFITM3 wild-type or IFITM3 phosphomutant Y20F after 16h of CsH treatment. IFITM3 integrated density was quantified by ImageJ. Zoomed images are shown. Data represent the mean ± SEM of four independent experiments (n=18 images), p values are for Mann Whitney test. **for p<0.01, ****for p<0.0001. IFITM3 degradation was assessed also by WB (n=4). C. THP1 Knock-out for Fyn and controls were pre-stimulated with IFNα for 24h and then transduced with VSV-G LV in presence or absence of CsH. Transduction was measured by FACS five days later. Data are shown as mean ± SEM (n=4), p values are for Mann Whitney test, **for p<0.01. D-E. THP1 over-expressing IFITM3 and controls (D) and HSPC (E) were transduced with VSV-G LV in presence or absence of CsH or the Src-kinase inhibitor PP2. Transduction was evaluated at FACS after five days. Data represent the mean ± SEM (n=5-3).
Article Snippet: Whole cell extracts were prepared as previously described ( , ).Samples were subjected to SDS-PAGE, transferred to PVDF membrane by electroblotting, and blotted with mouse polyclonal antibody CypA Ab (1:500 dilution, Santa-Cruz Biotechnology catalogue number sc-134310); mouse monoclonal antibody (Ab) raised against CypD/F (1:1000 dilution, Abcam catalogue number [E11AE12BD4] ab110324),
Techniques: Expressing, Transduction, MANN-WHITNEY, Immunofluorescence, Microscopy, Knock-Out
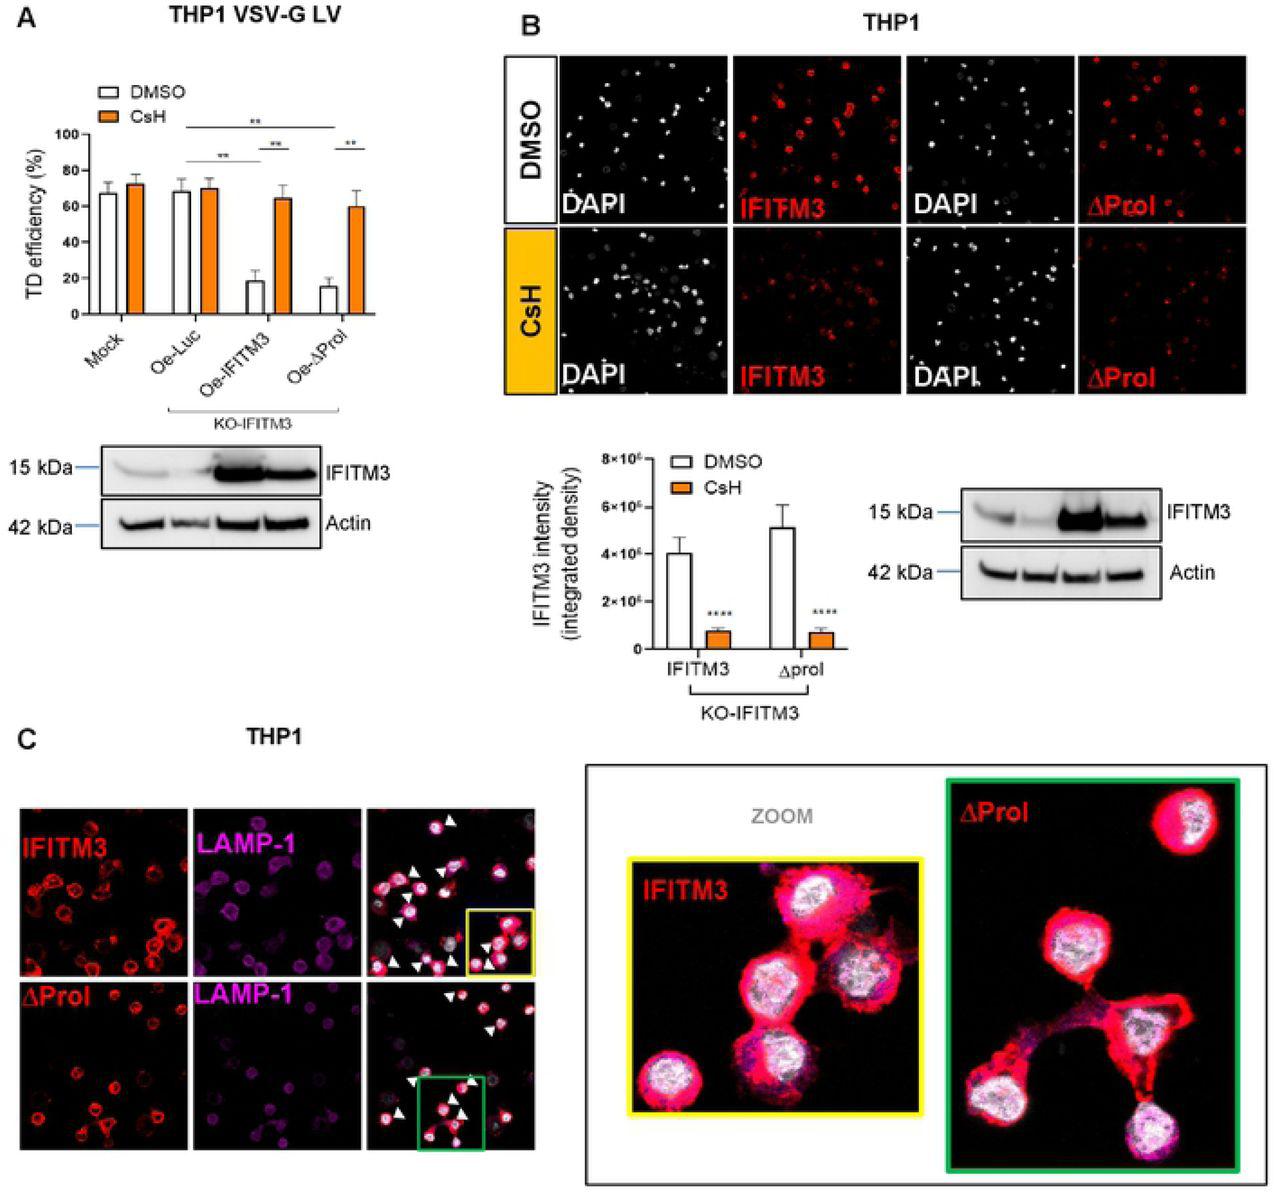
Journal: bioRxiv
Article Title: The lysine-rich intracellular loop and cell type-specific co-factors are required for IFITM3 antiviral immunity in hematopoietic stem cells
doi: 10.1101/2021.04.06.438585
Figure Lengend Snippet: A. THP1 over-expressing (Oe) IFITM3 wild-type, IFITM3 defective for the interaction domain with the ubiquitin ligase NEDD4 (ΔProl) or control were transduced at MOI 1 with VSV-G LV. Transduction efficiency was evaluated by FACS five days post-TD. Data represent the mean ± SEM (n=7), p values are for Mann Whitney test **for p<0.01. IFITM3 protein expression was measured by WB at time of transduction (n=4). B. IFITM3 wild-type and IFITM3 ΔProl degradation by CsH was assessed by IF and WB in THP1 after 16h of CsH treatment. IFITM3 was quantified through ImageJ. Data represent the mean ± SEM of four independent experiments (n=12 images), p values are for Mann Whitney test. ****for p<0.0001. C. Co-localization (purple areas marked by white arrows) of IFITM3 wild-type and ΔProl proteins (in red) with the lysosome associated membrane protein 1 (LAMP1) marker (in violet) was evaluated by immunofluorescence using TCS SP5 Leica confocal microscope 60x with oil (n=12 images). Zooms of the yellow and green boxed areas are shown on the left.
Article Snippet: Whole cell extracts were prepared as previously described ( , ).Samples were subjected to SDS-PAGE, transferred to PVDF membrane by electroblotting, and blotted with mouse polyclonal antibody CypA Ab (1:500 dilution, Santa-Cruz Biotechnology catalogue number sc-134310); mouse monoclonal antibody (Ab) raised against CypD/F (1:1000 dilution, Abcam catalogue number [E11AE12BD4] ab110324),
Techniques: Expressing, Ubiquitin Proteomics, Control, Transduction, MANN-WHITNEY, Membrane, Marker, Immunofluorescence, Microscopy

Journal: bioRxiv
Article Title: The lysine-rich intracellular loop and cell type-specific co-factors are required for IFITM3 antiviral immunity in hematopoietic stem cells
doi: 10.1101/2021.04.06.438585
Figure Lengend Snippet: A. THP1 over-expressing (Oe) IFITM3 wild-type, IFITM3 lysine to arginine mutants or control were transduced at MOI 1 with VSV-G LV. Transduction level was measured at FACS five days after transduction. Data represent the mean ± SEM (n=7), p values are for Mann Whitney test. * for p<0.05, **for p<0.01. IFITM3 protein levels were assessed by WB at time of transduction. B. IFITM3 wild-type and single lysine mutants co-localization with LAMP-1 was evaluated by IF. Immunofluorescence images were acquired using TCS SP5 Leica confocal microscope, 60x with oil. Zoomed images are shown (n=12). C. Immunofluorescence images were performed using TCS SP5 Leica confocal microscope, 60x with oil on THP1 over-expressing IFITM3 or IFITM3 single lysine mutants after 16h treatment with CsH. IFITM3 intensity was quantified by ImageJ. Data represent the mean ± SEM of five experiments (n=12), p values are for Mann Whitney test. * for p<0.05, **for p<0.01, ***for p<0.001, ****for p<0.0001.
Article Snippet: Whole cell extracts were prepared as previously described ( , ).Samples were subjected to SDS-PAGE, transferred to PVDF membrane by electroblotting, and blotted with mouse polyclonal antibody CypA Ab (1:500 dilution, Santa-Cruz Biotechnology catalogue number sc-134310); mouse monoclonal antibody (Ab) raised against CypD/F (1:1000 dilution, Abcam catalogue number [E11AE12BD4] ab110324),
Techniques: Expressing, Control, Transduction, MANN-WHITNEY, Immunofluorescence, Microscopy

Journal: bioRxiv
Article Title: The lysine-rich intracellular loop and cell type-specific co-factors are required for IFITM3 antiviral immunity in hematopoietic stem cells
doi: 10.1101/2021.04.06.438585
Figure Lengend Snippet: A. Scheme of IFITM3 protein configuration. The lysine residues mutated into arginines are highlighted in red. B. THP1 over-expressing (Oe) IFITM3 wild-type, IFITM3 lysine-less mutant or control were transduced at MOI 1 with VSV-G LV. IFITM3 protein expression was evaluated by WB at time of TD (n=4). Transduction level was measured by FACS. Error bars represents the mean ± SEM (n=8), p value are for Mann Whitney test. ****for p<0.0001. C-D. Immunofluorescence images were performed using TCS SP5 Leica confocal microscope, 60x with oil on THP1 (C) or MDM (D) to assess co-localization (purple area marked by white arrows) of IFITM3 and IFITM3 lysin-less mutant (in red) with the lysosomal marker LAMP1 (in blue). Zoomed images are shown for THP1. E. Human monocyte-derived macrophages (MDM) were pre-stimulated with IFNα for 24h and then transduced with LV at MOI 1. Transduction efficiency was measured by FACS five days after TD. Data are shown as mean ± SEM (n=7) F-G. IFITM3 or IFITM3 lysine-less degradation by CsH was investigated by IF in THP1 and MDM after 16h treatment with CsH. CsH-mediated degradation of IFITM3 was also confirmed by WB in THP1. IFITM3 protein expression was quantified by ImageJ. Data represent the mean ± SEM of at least three experiments (n>12), p values are for Mann Whitney test. **for p<0.01, ****for p<0.0001.
Article Snippet: Whole cell extracts were prepared as previously described ( , ).Samples were subjected to SDS-PAGE, transferred to PVDF membrane by electroblotting, and blotted with mouse polyclonal antibody CypA Ab (1:500 dilution, Santa-Cruz Biotechnology catalogue number sc-134310); mouse monoclonal antibody (Ab) raised against CypD/F (1:1000 dilution, Abcam catalogue number [E11AE12BD4] ab110324),
Techniques: Expressing, Mutagenesis, Control, Transduction, MANN-WHITNEY, Immunofluorescence, Microscopy, Marker, Derivative Assay

Journal: bioRxiv
Article Title: The lysine-rich intracellular loop and cell type-specific co-factors are required for IFITM3 antiviral immunity in hematopoietic stem cells
doi: 10.1101/2021.04.06.438585
Figure Lengend Snippet: A. Partial protein alignment of the lysine-rich CIL domain of human antiviral IFITMs and IFITM3 across different species . B. IFITM3 dimerization and oligomerization was assessed by native PAGE followed by WB analysis in THP1. IFITM3 higher order protein complex bands are highlighted by the asterisk. Normalized ratios between IFITM3 dimers and higher order complexes was quantified by ImageJ. C. K562 over-expressing (Oe) IFITM3 or controls were transduced with VSV-G LV (n=7). Transduction levels were assessed by FACS five days after TD. D. K562 were pre-stimulated with IFNα for 24h and then transduced with LV at MOI 1. Transduction efficiency was measured by FACS five days after TD. IRF7 and IFITM3 mRNA levels were measured by qPCR to assess ISG induction by IFNα at the time of transduction Data are shown as mean ± SEM (n=3). E. IFITM3 localization was analyzed by IF in K562, zoomed images are shown (n=12). F. Transduction efficiency was measured by FACS in THP1 over-expressing (Oe) IFITM3 wild-type, IFITM3 triple lysine mutant or control transduced at MOI 1 with VSV-G LV. Data are mean ± SEM (n=5), p values are for Mann Whitney test. * for p<0.05. G. Degradation of IFITM3 wild-type and triple lysine mutant IFITM3 was measured after 16h treatment with CsH in THP1 and MDM by IF. Data represent the mean ± SEM of at least three independent experiments (n=12 images), p values are for Mann Whitney test. * for p<0.05, ****for p<0.0001.
Article Snippet: Whole cell extracts were prepared as previously described ( , ).Samples were subjected to SDS-PAGE, transferred to PVDF membrane by electroblotting, and blotted with mouse polyclonal antibody CypA Ab (1:500 dilution, Santa-Cruz Biotechnology catalogue number sc-134310); mouse monoclonal antibody (Ab) raised against CypD/F (1:1000 dilution, Abcam catalogue number [E11AE12BD4] ab110324),
Techniques: Clear Native PAGE, Expressing, Transduction, Mutagenesis, Control, MANN-WHITNEY
Journal: The EMBO journal
Article Title: Interferon-inducible phospholipids govern IFITM3-dependent endosomal antiviral immunity.
doi: 10.15252/embj.2022112234
Figure Lengend Snippet: Figure 7. IFITM1 and plasma membrane mutants IFITM3 inhibit SARS CoV2 entry and infection.
Article Snippet: Samples were subjected to SDS–PAGE using Bolt 4–12% Bis-Tris Plus Gels (Thermo Fisher Scientific), transferred to PVDF membrane by electroblotting, and blotted with rabbit anti-IFITM3 polyclonal Ab (1:1,000 dilution, proteintech Cat# 11714-1-AP); rabbit anti-IFITM2 polyclonal Ab (1:2,500, proteintech Cat# 12769-1-AP);
Techniques: Clinical Proteomics, Membrane, Infection
Journal: Cancer Science
Article Title: B7H3 increases ferroptosis resistance by inhibiting cholesterol metabolism in colorectal cancer
doi: 10.1111/cas.15944
Figure Lengend Snippet: B7H3 knockdown promotes ferroptosis in colorectal cancer. (A) B7H3 protein levels in NCM460, RKO, HCT116, HT29, HCT8, SW480, and SW620 cells were analyzed by western blotting. (B, C) Protein expression of B7H3 in HCT116 and RKO cells treated with B7H3 shRNA (sh‐B7H3) or negative control RNA (NC) was analyzed by (B) western blotting and (C) flow cytometry. (D) mRNA levels of B7H3 in HCT116 and RKO cells transfected with sh‐B7H3 or NC were measured by RT‐quantitative PCR (qPCR). (E) Representative images of HCT116 and RKO cells cotreated with sh‐B7H3 and RSL3 (5 μM). (F, G) Viability of (F) HCT116 and (G) RKO cells treated with RSL3 was tested by CCK‐8 assay. (H) Malondialdehyde (MDA) content and (I) iron load in HCT116 and RKO cells cotreated with sh‐B7H3 and RSL3 (5 μM). (J, K) mRNA expression of ferritin light chain (FTL), ferritin heavy chain (FTH), prostaglandin‐endoperoxide synthase 2 (PTGS2), and glutathione peroxidase 4 (GPX4) in HCT116 (J) and RKO (K) cells cotreated with sh‐B7H3 and RSL3 (5 μM) was measured by RT‐qPCR. Results are presented as mean ± SD. * p < 0.05, ** p < 0.01, *** p < 0.001. ns, not significant.
Article Snippet: The sections were incubated with a rabbit
Techniques: Knockdown, Western Blot, Expressing, shRNA, Negative Control, Flow Cytometry, Transfection, Real-time Polymerase Chain Reaction, CCK-8 Assay, Quantitative RT-PCR

Journal: Cancer Science
Article Title: B7H3 increases ferroptosis resistance by inhibiting cholesterol metabolism in colorectal cancer
doi: 10.1111/cas.15944
Figure Lengend Snippet: B7H3 overexpression suppresses ferroptosis in colorectal cancer cells. (A, B) Protein levels of B7H3 in HCT116 and RKO cells with stable B7H3 overexpression (OE‐B7H3) were analyzed by (A) western blotting and (B) flow cytometry. (C) mRNA levels of B7H3 in HCT116 and RKO cells with OE‐B7H3 were measured by RT‐quantitative PCR (qPCR). (D) Representative images of HCT116 or RKO cells cotreated with OE‐B7H3 and RSL3 (5 μM). (E, F) Viability of HCT116 (E) and RKO (F) cells treated with RSL3 was tested by CCK‐8 assay. (G) Malondialdehyde (MDA) content and (H) iron load in HCT116 and RKO cells treated with RSL3 (5 μM). (I, J) mRNA expression of ferritin light chain (FTL), ferritin heavy chain (FTH), prostaglandin‐endoperoxide synthase 2 (PTGS2), and glutathione peroxidase 4 (GPX4) in (I) HCT116 and (J) RKO cells treated with RSL3 (5 μM) was measured by RT‐qPCR. Results are presented as mean ± SD. * p < 0.05, ** p < 0.01, *** p < 0.001. EV, empty vector; ns, not significant.
Article Snippet: The sections were incubated with a rabbit
Techniques: Over Expression, Western Blot, Flow Cytometry, Real-time Polymerase Chain Reaction, CCK-8 Assay, Expressing, Quantitative RT-PCR, Plasmid Preparation

Journal: Cancer Science
Article Title: B7H3 increases ferroptosis resistance by inhibiting cholesterol metabolism in colorectal cancer
doi: 10.1111/cas.15944
Figure Lengend Snippet: B7H3 is involved in ferroptosis and cholesterol metabolism in colorectal cancer cells in vivo. (A) Representative images of B7H3‐knockdown HCT116 tumors in nude mice fed a high cholesterol diet. (B) Volumes of B7H3‐knockdown HCT116 tumors in nude mice fed a high cholesterol diet. (C) Weights of B7H3‐knockdown HCT116 tumors in nude mice fed a high cholesterol diet. (D) Images of immunohistochemical (IHC) analysis of sterol regulatory element binding protein 2 (SREBP2) and prostaglandin‐endoperoxide synthase 2 (PTGS2) protein expression in tumor tissue of nude mice fed a high cholesterol diet ( n = 5). One representative image of each is shown. (E) PTGS2 and (F) SREBP2 protein expression based on the IHC staining index in tumor tissues of the xenograft model. (G) Total iron and (H) malondialdehyde (MDA) content was measured in tumor tissues of nude mice fed a high cholesterol diet ( n = 5). Results are presented as mean ± SEM. * p < 0.05, ** p < 0.01. NC, negative control; ns, not significant.
Article Snippet: The sections were incubated with a rabbit
Techniques: In Vivo, Knockdown, Immunohistochemical staining, Binding Assay, Expressing, Immunohistochemistry, Negative Control

Journal: Cancer Science
Article Title: B7H3 increases ferroptosis resistance by inhibiting cholesterol metabolism in colorectal cancer
doi: 10.1111/cas.15944
Figure Lengend Snippet: B7H3 − prostaglandin‐endoperoxide synthase 2 (PTGS2) + sterol regulatory element binding protein 2 (SREBP2) + cells promote an improved prognosis in colorectal cancer (CRC) patients. (A, B) Representative images of multiplex immunohistochemistry assay of B7H3 (red), PTGS2 (green), and SREBP2 (orange) expression in (A) CRC tumor tissue and (B) adjacent normal tissue. Nuclei and tumor epithelial cells are marked by DAPI (blue) and cytokeratin (CK; yellow), respectively. Scale bar, 50 μm. (C) Percentages of B7H3 + cells in tumor tissues ( n = 89) and normal tissues ( n = 84). (D) Kaplan–Meier analysis of the survival rate of 89 CRC patients stratified according to the B7H3 + cells level. (E) Percentages of B7H3 − PTGS2 + SREBP2 + cells in tumor tissues ( n = 89) and normal tissues ( n = 84). (F) Kaplan–Meier analysis of the survival rate of 89 CRC patients stratified into B7H3 − PTGS2 + SREBP2 + cells low (proportion ≤ median value) and B7H3 − PTGS2 + SREBP2 + cells high (proportion > median value)groups. Results are presented as mean ± SD. ** p < 0.01, **** p < 0.0001.
Article Snippet: The sections were incubated with a rabbit
Techniques: Binding Assay, Multiplex Assay, Immunohistochemistry, Expressing

Journal: Cancer Science
Article Title: B7H3 increases ferroptosis resistance by inhibiting cholesterol metabolism in colorectal cancer
doi: 10.1111/cas.15944
Figure Lengend Snippet: Schematic diagram of the proposed mechanism by which B7H3 inhibits ferroptosis through cholesterol metabolism in colorectal cancer cells through the AKT/sterol regulatory element binding protein 2 (SREBP2) pathway. FTH, ferritin heavy chain; FTL, ferritin light chain; GPX4, glutathione peroxidase 4; MDA, malondialdehyde; PTGS2, prostaglandin‐endoperoxide synthase 2.
Article Snippet: The sections were incubated with a rabbit
Techniques: Binding Assay
Journal: Antioxidants
Article Title: Continuous Monochromatic Blue Light Exacerbates High-Fat Diet-Induced Kidney Injury via Corticosterone-Mediated Oxidative Stress
doi: 10.3390/antiox12051018
Figure Lengend Snippet: Effects of continuous monochromatic light exposure on renal histology and apoptosis. ( A ) Representative H&E, PAS, and IHC staining of PCNA in the kidney sections (scale: 25 μm in H&E staining; 50 μm in PAS and IHC staining); ( B ) area of adipocyte; ( C ) kidney histological score; ( D ) IOD of PCNA; relative protein levels of the kidney ( E ) Cleaved Caspase-3; ( F ) BAX; ( G ) BCL2; ( H ) Western blot bands of BCL2; BAX; Cleaved Caspase-3. LD-WF: high-fat diet mice under light-dark cycle with white light; LL-WF: high-fat diet mice under continuous white light; LL-BF: high-fat diet mice under continuous monochromatic blue light; LL-GF: high-fat diet mice under continuous monochromatic green light. These results are shown as means ± SEM. Values without the same letter were significantly different ( p < 0.05) from each other.
Article Snippet: Samples were transferred to the PVDF membrane and blocked with a blocking buffer (5% nonfat powdered milk in TBST) for 1.5 h. After blocking, the membranes were incubated with the following primary antibodies: α-smooth-muscle actin-α (α-SMA) rabbit monoclonal Ab (1:2000, Proteintech), iNOS rabbit monoclonal Ab (1:1000, CST), nuclear factor erythroid (NRF2) rabbit monoclonal Ab (1:1000, Proteintech), HO-1 rabbit monoclonal Ab (1:1000, CST), TLR4 mouse monoclonal Ab (1:1000, Santa Cruz), total and phosphorylated-P65 rabbit monoclonal Ab (1:1000, CST), Glucocorticoid receptor (GR) mouse monoclonal Ab (1:20,000, Proteintech),
Techniques: Immunohistochemistry, Staining, Western Blot
Journal: European journal of immunology
Article Title: Influenza A virus abrogates IFN-gamma response in respiratory epithelial cells by disruption of the Jak/Stat pathway.
doi: 10.1002/eji.200737045
Figure Lengend Snippet: Figure 11. Detection of IFNGR1, IFNGR2, Jak1, Jak2, and Stat1a expression in influenza A virus-infected A549 cells. A549 cells were infected with influenza Aichi at an MOI of 10 or left uninfected as described in Fig. 2. The infected cells and uninfected control cells were treated with IFN-c (1000 U/mL) for 1 h or left untreated. (A) Total RNA was extracted and subject to RT-PCR analysis with primers specific for IFNGR1, IFNGR2, Jak1, Jak2, and Stat1. (B) The protein levels were detected by western blot assay. A549 cells were infected and treated with IFN-c as described above. Total cell lysates (40 lg) were directly analyzed by western blotting with Ab to IFNGR1, IFNGR2, Jak1, Jak2, and Stat1a. Results shown are representative of three separate experiments.
Article Snippet: For detection of IFNGR1, IFNGR2, Jak1, and Jak2 , primary Ab used for western analyses included a rabbit polyclonal affinity purified anti-IFNGR1 Ab (1:2000; Santa Cruz Biotechnology), a
Techniques: Expressing, Virus, Infection, Control, Reverse Transcription Polymerase Chain Reaction, Western Blot
Journal: Cancer Science
Article Title: B7H3 increases ferroptosis resistance by inhibiting cholesterol metabolism in colorectal cancer
doi: 10.1111/cas.15944
Figure Lengend Snippet: B7H3 suppresses cholesterol metabolism. (A) Differentially expressed genes (DEGs) between negative control (NC) and shB7H3 HCT116 cells are shown in a volcano plot. Red dots represent upregulated DEGs; blue dots represent downregulated DEGs. (B) Bubble plots of the Gene Ontology biological process enrichment analysis. (C) Sankey diagram showing the connections among cholesterol metabolism‐related hub genes. (D) Total cholesterol levels in B7H3 knockdown HCT116 and RKO cells. (E) Free cholesterol concentrations in B7H3 knockdown HCT116 and RKO cells were determined by filipin III staining. (F) Low‐density lipoprotein (LDL) cholesterol levels in B7H3 WT and knockdown HCT116 and RKO cells were examined. (G, H) Expression of cholesterol metabolism‐related genes ( SQLE , SREBP2 , HMGCS , LDLR ) in B7H3‐knockdown (G) HCT116 and (H) RKO cells was measured by RT‐quantitative PCR. Results are presented as mean ± SD. * p < 0.05, ** p < 0.01, *** p < 0.001. FC, fold change; FDR, false discovery rate; ns, not significant.
Article Snippet: The sections were incubated with a rabbit anti‐mouse PTGS2 Ab (1:200, #12375‐1‐AP; Proteintech) and a rabbit
Techniques: Negative Control, Knockdown, Staining, Expressing, Real-time Polymerase Chain Reaction

Journal: Cancer Science
Article Title: B7H3 increases ferroptosis resistance by inhibiting cholesterol metabolism in colorectal cancer
doi: 10.1111/cas.15944
Figure Lengend Snippet: B7H3 regulates ferroptosis through cholesterol metabolism. (A) Protein levels of nuclear sterol regulatory element binding protein 2 (n‐SREBP2), p‐AKT, and AKT in B7H3 knockdown HCT116 and RKO cells. Histone H3 served as a nuclear loading control. GAPDH served as a loading control. (B) Protein levels of n‐SREBP2, p‐AKT, and AKT in B7H3‐overexpressing HCT116 and RKO cells. Histone H3 served as a nuclear loading control. GAPDH served as a loading control. (C) Total cholesterol and (D) low‐density lipoprotein (LDL) cholesterol levels in B7H3 knockdown HCT116 and RKO cells after treatment with 4 μm betulin for 48 h. (E) Malondialdehyde (MDA) and (F) total iron content in B7H3 knockdown HCT116 and RKO cells cotreated with RSL3 and betulin. Results are presented as mean ± SD. * p < 0.05, ** p < 0.01, *** p < 0.001. NC, negative control.
Article Snippet: The sections were incubated with a rabbit anti‐mouse PTGS2 Ab (1:200, #12375‐1‐AP; Proteintech) and a rabbit
Techniques: Binding Assay, Knockdown, Control, Negative Control
Journal: Cancer Science
Article Title: B7H3 increases ferroptosis resistance by inhibiting cholesterol metabolism in colorectal cancer
doi: 10.1111/cas.15944
Figure Lengend Snippet: B7H3 is involved in ferroptosis and cholesterol metabolism in colorectal cancer cells in vivo. (A) Representative images of B7H3‐knockdown HCT116 tumors in nude mice fed a high cholesterol diet. (B) Volumes of B7H3‐knockdown HCT116 tumors in nude mice fed a high cholesterol diet. (C) Weights of B7H3‐knockdown HCT116 tumors in nude mice fed a high cholesterol diet. (D) Images of immunohistochemical (IHC) analysis of sterol regulatory element binding protein 2 (SREBP2) and prostaglandin‐endoperoxide synthase 2 (PTGS2) protein expression in tumor tissue of nude mice fed a high cholesterol diet ( n = 5). One representative image of each is shown. (E) PTGS2 and (F) SREBP2 protein expression based on the IHC staining index in tumor tissues of the xenograft model. (G) Total iron and (H) malondialdehyde (MDA) content was measured in tumor tissues of nude mice fed a high cholesterol diet ( n = 5). Results are presented as mean ± SEM. * p < 0.05, ** p < 0.01. NC, negative control; ns, not significant.
Article Snippet: The sections were incubated with a rabbit anti‐mouse PTGS2 Ab (1:200, #12375‐1‐AP; Proteintech) and a rabbit
Techniques: In Vivo, Knockdown, Immunohistochemical staining, Binding Assay, Expressing, Immunohistochemistry, Negative Control
Journal: Cancer Science
Article Title: B7H3 increases ferroptosis resistance by inhibiting cholesterol metabolism in colorectal cancer
doi: 10.1111/cas.15944
Figure Lengend Snippet: B7H3 − prostaglandin‐endoperoxide synthase 2 (PTGS2) + sterol regulatory element binding protein 2 (SREBP2) + cells promote an improved prognosis in colorectal cancer (CRC) patients. (A, B) Representative images of multiplex immunohistochemistry assay of B7H3 (red), PTGS2 (green), and SREBP2 (orange) expression in (A) CRC tumor tissue and (B) adjacent normal tissue. Nuclei and tumor epithelial cells are marked by DAPI (blue) and cytokeratin (CK; yellow), respectively. Scale bar, 50 μm. (C) Percentages of B7H3 + cells in tumor tissues ( n = 89) and normal tissues ( n = 84). (D) Kaplan–Meier analysis of the survival rate of 89 CRC patients stratified according to the B7H3 + cells level. (E) Percentages of B7H3 − PTGS2 + SREBP2 + cells in tumor tissues ( n = 89) and normal tissues ( n = 84). (F) Kaplan–Meier analysis of the survival rate of 89 CRC patients stratified into B7H3 − PTGS2 + SREBP2 + cells low (proportion ≤ median value) and B7H3 − PTGS2 + SREBP2 + cells high (proportion > median value)groups. Results are presented as mean ± SD. ** p < 0.01, **** p < 0.0001.
Article Snippet: The sections were incubated with a rabbit anti‐mouse PTGS2 Ab (1:200, #12375‐1‐AP; Proteintech) and a rabbit
Techniques: Binding Assay, Multiplex Assay, Immunohistochemistry, Expressing
Journal: Cancer Science
Article Title: B7H3 increases ferroptosis resistance by inhibiting cholesterol metabolism in colorectal cancer
doi: 10.1111/cas.15944
Figure Lengend Snippet: Schematic diagram of the proposed mechanism by which B7H3 inhibits ferroptosis through cholesterol metabolism in colorectal cancer cells through the AKT/sterol regulatory element binding protein 2 (SREBP2) pathway. FTH, ferritin heavy chain; FTL, ferritin light chain; GPX4, glutathione peroxidase 4; MDA, malondialdehyde; PTGS2, prostaglandin‐endoperoxide synthase 2.
Article Snippet: The sections were incubated with a rabbit anti‐mouse PTGS2 Ab (1:200, #12375‐1‐AP; Proteintech) and a rabbit
Techniques: Binding Assay